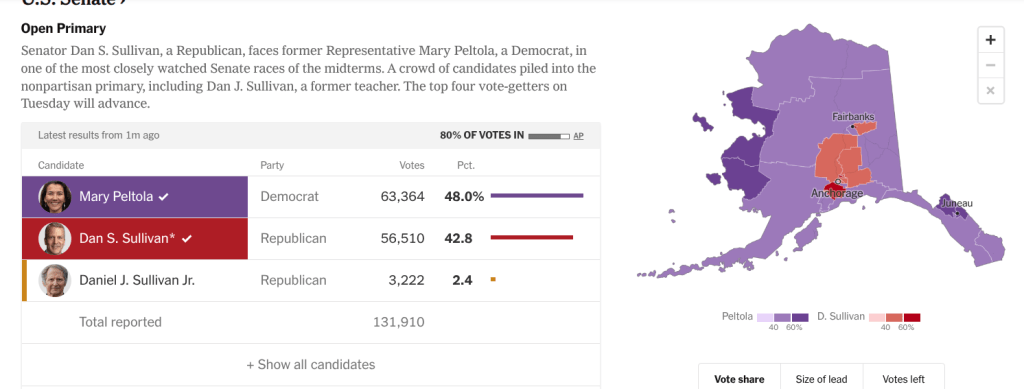
The above is from the New York Times’s coverage of last night’s US Senate primary in Alaska. Every candidate, from whatever party, is in the same field, and the top four finishers advance to the general election–no separate Democratic and Republican primaries in Alaska. As you can see, while the top four advance, the general election is going to be between Democrat Mary Peltola and the incumbent Republican, Dan S. Sullivan. The third place finisher, Daniel J Sullivan Jr, who got less than 3 percent of the vote, is a retired teacher widely regarded as a “spoiler” candidate–he’s exploiting the coincidence that his name matches that of the incumbent.
As you can also see, the result, with 80 percent of the vote tabulated, tends to confirm the view that this red state Senate seat is one that the Democrats can flip. If you give “real” Dan Sullivan all the ballots marked for the “other” Dan Sullivan, “real” Dan Sullivan, the Republican incumbent, is still a few thousand short of Peltola’s total. And Peltola is no novice: she has represented the state in Congress as its at-large representative–the entire state is a single congressional district–which means that in the recent past she has won statewide elections in Alaska. It’s been argued that the so-called jungle primary has benefited her, since, in her first victory, only three candidates received a significant number of votes, and two of them, Sarah Palin and Nick Begich, were Republicans. But Alaska’s use of ranked choice voting casts doubt upon the theory that Peltola won only because the Republican vote was split. In her first election to the House, Peltola received 40 percent of the vote in the first round, compared to 31 percent for Palin and 28 percent for Begich. It’s true, then, that the combined Republican vote was substantially more than what Peltola was able to garner. But, under the provisions of ranked choice voting, a candidate has to get to 50 percent to win, and the election therefore was determined by the second choice indicated by Begich voters. You might think that Begich voters would prefer Palin, another Republican, and in fact they did, but so narrowly that after Begich’s votes were redistributed Peltola had won, 51.5 to 48.5 percent. If you do the math, just over a third of people who voted in the first round for Republican Begich preferred Democrat Peltola to Palin.
Well, the argument about ranked choice voting is for another day, but I personally am in favor of any means of allowing voters to express their opinion more distinctly. Permit us to divulge not only who we like the most but also who we hate the most. The result of the “second round” tally indicates that, had Peltola won a Democratic primary and Palin a Republican one, Peltola would have won the general election on account of either her cross-over appeal or Palin’s radioactivity, take your pick. Note, too, that ranked choice voting frees us of the dilemma usually described by the phrase “strategic vote.” If you’re thinking that a vote for your favorite candidate will help the one you most dislike to win . . . no worries, vote for your fave, it will help hold the object of your hate below 50 percent, and then indicate who you think is second best, too.
But, it’s argued, ranked choice voting is so confusing. Sure, lots of things are confusing to the easily confused. Is it really necessary to dumb down our entire democratic civilization in order to avoid confusing people who are probably also confused by roundabouts, self checkouts, and the prose of opinion pieces in the newspaper?
Okay, maybe the ranked choice debate turned out to be for today, at least to a degree, but what really interested me about the above Times graphic was the geographic pattern of the vote. Here in the lower 48, it’s almost a universal law that metropolitan areas are strongly Democratic in their political orientation, whereas the rural and small town vote is overwhelmingly Republican. One consequence of this is that, in any relatively close election, the ubiquitous red-blue map looks like a Republican romp–until, on inspection, it turns out that the occasional dark blue dot marks the location of a city, and the encircling lighter blue its populous suburbs. But this doesn’t seem to be the case in Alaska. Perhaps four-fifths of the map is Peltola’s color, and the only reason the overall vote was somewhat close is that Sullivan did well in and around Anchorage, where 40 percent of Alaskans live. I’ve checked and this pattern seems to hold. For example, here is the map for the 2014 US Senate race in Alaska–I picked it because it shows what an evenly divided statewide election looks like:
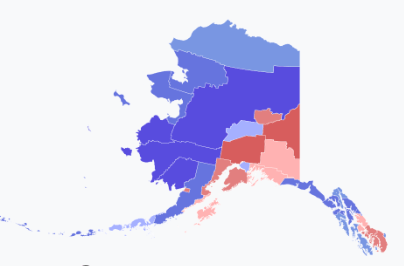
The Democrat won the blue areas, and got more than 70 percent of the vote in the dark blue areas–but lost the election by 2 percentage points. I’d like to know why the rural-metropolitan divide in Alaska is the reverse of what prevails in the rest of the country. Even being clueless about that, however, it appears that this year’s primary map, if repeated in the general election, will net the Democrats a Senate seat. When Republicans win, they are competitive in the southeastern panhandle, and they win the Kenai Peninsula in the south central part of the state. Yesterday, Peltola beat Sullivan in every district of the panhandle, including by 63 to 28 percent in the Juneau district. She also got more votes than Sullivan across the Kenai Peninsula, which is home to several mid-sized towns–mid-sized by Alaska standards–that, according to this article, typically favor the Republicans, as they did in 2014 and, I notice, by a wide margin in the last presidential election.
 Eric the Blue
Leave a comment